
The road(map) to Manufacturing 4.0 is paved with good data
By Thomas Luck and Rick Homman 
Successful transformation to Manufacturing 4.0 (M4.0) is both a technical and a management endeavor. It’s a journey that requires a roadmap unique to your organization and that recognizes your capabilities, internal and external environment, and the challenges relative to your operations. It must be based on a leadership consensus and be achievable, to provide short-term gains to create and sustain momentum.
Why Standing Still Is Moving Backwards
The year 2020 has thrown many challenges at the manufacturing community, no matter what industry they represented. We have faced supply-chain issues, government restrictions, staffing hurdles, and reduced demand while others saw a tremendous increase in demand, to name just a few of the challenges.
Manufacturers that prior to 2020 invested in themselves in key areas of technology and took a deep look into their processes and increasing their portfolio of capabilities managed some sense of stability throughout the year. The others faced and are still facing an uphill battle. It may be to just keep the lights on or to regain market share they may have lost, not being as agile as they once thought they were.
At the same time, we are thinking about how M4.0 plays into the grand scheme of things. Do we really understand what Manufacturing 4.0 even is — and would it have helped during this trying time? The simple answer is yes. A very basic idea around M4.0 — which is often equated with Industry 4.0, a term coined at a conference in Hanover, Germany, a few years ago, or Smart Manufacturing — is the use of sensors and digital transfer of data. The M4.0 paradigm comprises major technological innovations including advanced robotics, IoT (Internet of Things), sensors, mobile services, 3-D printing, and data analytics.
To understand what it does — and surprisingly, what it does not take — to start down the path of M4.0, let’s explore the foundation of M4.0, including data maturity and pain points. Then we can build the business case and execute the initial phase of an implementation within the strategy.
Understanding Data Maturity
The first step is to understand your data maturity. There’s certainly no shortage of raw data in manufacturing organizations. In fact, most are being overwhelmed by the explosion of data coming from machines and other sources. The challenge is collecting, transforming, aggregating, and relating this data, and then translating it into useful and actionable information in a timely manner.

“Manufacturers today must realize that in most cases a small investment in understanding their processes and data will return the largest payback.”
So it’s essential to get the data right before you can advance on your M4.0 journey. Starting with the technical prerequisites, such as the IT infrastructure and machine connectivity, you can begin that journey.
We have developed a Data Maturity Model to help you understand your data maturity. Using an associated assessment tool, you can evaluate where you are and what you need to do to get to the next level. See Figure 1
At the first level, the focus is on daily survival. Reaction time to issues is slow because it’s hard to see where the issues are and there is little time to react. Data is disbursed throughout different automated and sometimes manual systems.
At the second level, the data-collection processes have improved, but analytical capabilities are limited. Data is often reentered to speadsheets or other tools resulting in manual effort, untimely analysis, and errors.
At the third level, data collection and analysis are now connected, yielding great benefit. The step from level 2 to level 3 is a big one in terms of operational effectiveness and connection between systems such as MES and ERP — thus connecting the “shop floor” and the “top floor.” Data is collected and analyzed in real time for immediate problem resolution and escalation.
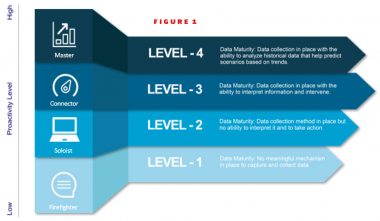
Finally, at the fourth level, the organization has predictive analytics, using a statistically based methodology to anticipate and prevent issues before they occur and drastically increasing operational performance.
In a recent survey we conducted, we found the average maturity level of manufacturers was 2.6. They had made progress in collecting and beginning to analyze data, but did not have adequate tools in place to do it in a complete and timely enough manner to be impacting performance at a desired level. Interestingly, we also found that 2.6 presented a roadblock. Getting to data maturity above that level requires a different approach and different technology.
Understanding Your Pain Points
But before introducing this new technology into your organization, it is critical to know where to apply it. This is the second step — understanding and prioritizing your pain points.
Pain points are the challenges, unique to your business, that keep you from achieving your potential performance. They can relate to areas such as costs, efficiency, quality, timely delivery, and ultimately competitiveness and customer satisfaction.
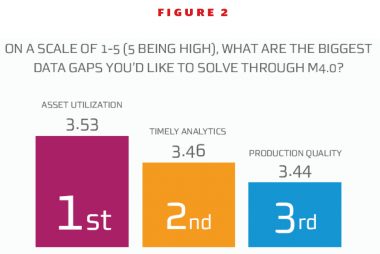
In another recent survey, we found the top pain points to be asset utilization, timely analytics, and production quality. See Figure 2
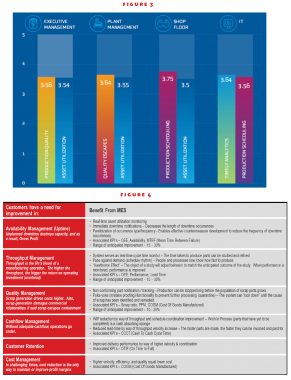
But more importantly, we found that the pain points varied depending on the individual’s role in the organization. For example, while asset utilization was the overall top pain point, it was in fact the second most critical pain point to executive management, plant management, and the shop floor. Executive management saw overall production quality as the top pain point, while plant management cited quality escapes and the shop floor cited production scheduling. Similarly, IT saw timely analytics as the top pain point, with production scheduling second. See Figure 3
The key to a successful M4.0 transformation is to gain consensus across these different viewpoints to understand and articulate what are the most important pains to be addressed, and to prioritize the rollout plan to assure that the areas with largest and quickest payback are first. But equally important is to show that the plan will subsequently address additional pain points, so each group has buy-in to see that their challenges receive attention.
In our survey, we also found that the top pain points varied by industry. For example, quality was the top focus area for aerospace, defense, and automotive, while asset utilization was the highest ranked for general manufacturing. Medical devices saw total operating cost as the top pain point, with process adherence close behind.
While these industry perspectives are not surprising, the key takeaway is to understand the unique pain points to your organization. This alignment will assure that the project is not just a technical success, but also a business success.
Building the Business Case
The pain points illustrated in our survey almost always tie directly back to three simple things —delay, defect, and deviation.
Delay is nothing more than a period of time by which an output is late or postponed. Delays absorb the most precious resource manufacturers possess — time. They also absorb cash.
Defects can be found within the processes tasked with creating value, and not just in the products we identify as “non-conforming.” Defects require rework, reengineering, or redesign, with the prefix “re” always equaling disproportionate amounts of lost time and money.
Deviation is simply the amount by which a measurement differs from a fixed value such as the mean. Locked-in processes establish a mean (average) performance and stick tightly to that level of performance. Fluctuations in performance always carry a cost (Taguchi Loss Function).
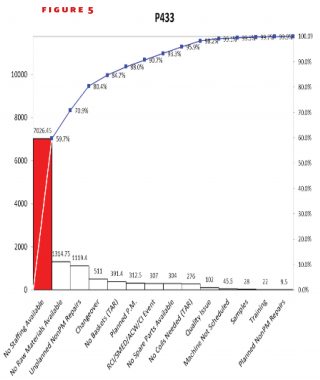
A strong business case for M4.0 will most often, directly, or indirectly, influence one of these three “D”s. Again, these three “D”s, at a more granular level, manifest in some of the pain points discussed in our survey. But there are more, and a strong business case identifies them with measurable outcomes: See Figure 4
In the following portion of a selected business case, lost revenue due to capacity constraints was a primary pain point. Analysis provided insights that pointed to a feeder operation as a significant capacity constraint, and the underlying cause of the constraint — poor uptime or availability at said constraint. See Figure 5
Following a deeper analytical dive, anticipated improvements (pulled from experience with previous and similar projects) were applied to current state performance (baseline performance) in order to establish a manageable and measurable outcome.
Outcome projections gave the solution provider and the client something to manage towards while providing rationalization for the cost of the project. Of significant interest to this business case, the client already had an internally developed MES in place to collect and analyze shop floor performance data. Unfortunately, this MES solution relied on manual manipulation/collection and it experienced delayed response time to operational feedback on the order of 8-12 hours. FORCAM’s ability to provide immediate and accurate performance data (without human manipulation) enabled the client to gain the insight necessary to impact performance at the time of need, not a shift or day later. The availability improvement driven by an immediate feedback mechanism was remarkable (+50%), almost immediate, and sustainable.
Governing and Executing the Implementation
An understanding of the current state of your organization’s data and technology, coupled with a prioritization of pain points derived from leadership consensus, provides the foundation for a strong business case and investment for change. The business case characterizes the starting point for beginning a project, and where the future state of data and technology can be measured against. It is this measurement that enables an organization to evaluate whether a project was successful and do so in terms relative to the organization’s perspective. Were the pain points alleviated? What was the impact to the business?


It is the business case that governs the intended purpose of the project or the program and helps maintain alignment among all the decision makers throughout implementation. While each business case is unique to each organization, an implementation methodology that provides more effective, efficient, and controlled project execution can be applied broadly across organizations that vary widely. And, for technology implementations that span multiple systems, consistent application of such methodologies facilitate resolution to any issues discovered thereafter.
The FORCAM Project Delivery Methodology (FPDM) was designed with this in mind — to provide a defined, repeatable, efficient, and thorough framework to work jointly with our customers to deliver successful projects. It describes the procedures, controls, documentation, human resources, and other materials required to initiate, execute, and close projects, or continue programs in successive waves of layered projects.
The project begins with the Initiation stage, which includes forming the project team, confirming the scope and timeline, provisioning resources, and, most importantly, establishing the governance model and finalizing the success criteria, as derived from the business case. This is critical to keeping the project on track as issues arise.
The next stage is Discovery. This stage entails developing detailed requirements for input to the fit-gap analysis. This begins the process of determining how the system will be configured and mapped to your unique business processes, including data normalization and business rules. In master data collection, the project team collects data such as machine details, IP addresses, workplaces, hierarchies, shift schedules, and users.
The Design stage includes conducting iterative prototyping and evaluating it in a Conference Room Pilot (CRP). This is conducted in successive iterations until the project team determines that a System Design Milestone has been achieved. This is followed by the Build stage. Key user training is held, utilizing the FORCAM Basic and Advanced Academy. This is followed by completing the system configuration and several layers of testing.
The Deployment stage is installing, moving, or copying the system from the quality assurance environment to the production environment. In the productivity baseline, data is taken from the system to build a baseline on, for example, machine utilization/OEE for future calculation of ROI of system integration. Final end user training occurs, the system is cutover to production, and high-level support is provided during system stabilization (Hypercare).
Finally, in the Closure stage, the system is transitioned to support. A key activity in Closure is to document use cases and confirm that the success criteria have been met. This ties back to the initial analysis work, assuring that the pain points have been addressed and the benefits contemplated in the business case can be realized. See Figure 6
The FORCAM Project Delivery Methodology (FPDM) was designed to provide a framework for repeatable implementation of FORCAM manufacturing execution systems effectively and efficiently. However, it was also designed to do this flexibly in layers of functionality or expandability across organizations, or in some combination thereof. It is the depth of the initial business case or subsequent business case refinements that help FORCAM consultants collaborate with decisionmakers. This team collaboration prioritizes the needs of the organization, and then guides the decisions about whether the FPDM is applied in one cycle or multiple cycles (additional functionality, production lines or sites) to achieve the objectives and progress upward on the Data Maturity Model.
It’s Not as Difficult and Expensive as You Think
For many manufacturers, the first objection with taking on a M4.0 project is assumed cost. What many may not realize is that they already have invested in people, technology, and process — the three pillars that help support the idea. What they haven’t done in many cases is started tying the data together, truly spending the time to understand it, and, most importantly, understanding how to react to what the data is telling them.
It’s very typical, for example, to throw capital at the assumed problem. A quick example: When not meeting production numbers, they buy a new expensive machine, which, as discussed earlier, may not be needed. On average (in our experience), 25% of the lead time for a product is value added, while 75% is not — and this is in the “good” plants. While the knee-jerk reaction is to purchase more equipment to increase “productivity,” what often happens if the value add ratio is not addressed, is that you’ll need to potentially double or triple your equipment to reach intended levels of productivity. So you buy some equipment, but not nearly enough, and still struggle, or you do buy enough and tie up your capital in equipment that is inefficiently run. Addressing root cause will always be cheaper than capital equipment purchases.
Manufacturers today must realize that in most cases a small investment in understanding their processes and data will return the largest payback. Could this eventually lead to a bigger investment? Absolutely, but at that point it is clearly understood why and the expected return.
For a successful transformation to Manufacturing 4.0, manufacturers must first build the foundation to ensure the right decisions are made going forward. M