Harnessing the Data Overload
How you can transform manufacturing data into actionable and timely information.
![]()
One of the ways Merriam-Webster defines “harness” is as a transitive verb meaning “to utilize.” When you harness a horse, the intent is to gain control of the animal to utilize its capacity for work. Data, in its essence, is like that horse — it does not provide tangible or measurable utility until it is harnessed in an actionable way. The wonderful thing about data is that if we can harness it, it can give us invaluable direction in the form of operation specific information. Of course, we need to know how to interpret what the information is saying, and we also need to know the appropriate actions to take based on that interpretation. To truly harness data, we need to capture it, control it, understand it, and convert it to action.
Is it easy? If you are good with horses, it can be. Same with data.
As discussed in previous articles, we have developed a model to illustrate the progressive levels of data maturity within manufacturing environments.
Additionally, we surveyed many manufacturing company executives and found that most of their respondent companies topped out at 2.6 on our four-level data-maturity model, where Level 1 indicates there is not a meaningful mechanism in place to capture and collect data, and Level 4 indicates a level of mastery to include predictive analytics. At 2.6, companies have a demonstrated data-collection mechanism in place, but still have deficits in their ability to interpret and leverage that data.1,2
“The effective capture of shop-floor data determines the effectiveness of the decisions you will make based on that data, so you cannot afford to get it wrong.”
Why are so many manufacturers stuck at the 2.6 level? We know that companies often use internal resources to navigate the road to the smart factory, and the journey often pauses or slows when those resources have reached their capability limit. To put it simply, many have tackled capture and control on their own with varying levels of success, but have uniformly fallen short of understanding an effective conversion. In our experience, it often requires outside expertise — someone who not only understands machine connectivity, but also understands how to manage and leverage the performance feedback provided by that connectivity — to get to a 3 on the data-maturity model. It also requires technology solutions capable of funneling the complexity of shop floor actions, transactions, and mishaps into an easy-to-understand performance narrative. With the potential availability of so much data, from so much activity, from so many sources, how does one capture, control, understand, and convert effectively?
Connecting and Transforming IIoT Data
Manufacturers must collect and standardize shop floor performance data before they can consume and convert it to action. A full-function IIoT/MES solution will provide the layer of functionality necessary to make this capture and control happen. This functional layer is commonly referred to as the “edge,” the layer in which different and multiple shop-floor signals are collected for consumption. This layer provides the connectors, plugins, servers, and adapters necessary to translate multiple disparate signals to something commonly understood and useful. Low latency is important, as is establishing a network infrastructure capable of handling the traffic of thousands of shop-floor actions and transactions … sometimes in the blink of an eye. The edge really is the data frontier, where order is brought to the untamed wilderness.
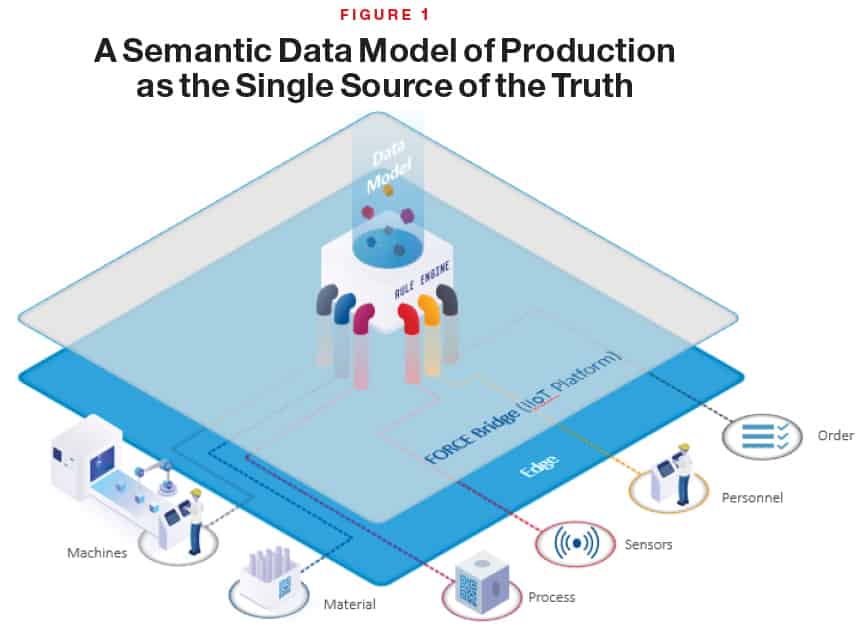
As you can imagine, bringing order to this wilderness can be a challenge since we are dealing with data sources including new and legacy systems, newer and antiquated pieces of equipment, and a diverse mix of PLCs. As a result, the edge needs a brain, a role typically filled by something we like to call a rule engine. The rule engine is responsible for building and managing the semantic data model, a model tasked with illustrating and organizing the relationships that exist among specific types of data. This model considers the data sources, data types, and co-dependencies of said data and organizes them into a single, unimpeachable source of truth (Figure 1).
If the technical expertise needed to bring all of this together on the shop floor does not exist within your organization, and it typically does not, it is strongly advised to use an external subject matter expert. The effective capture of shop-floor data determines the effectiveness of the decisions you will make based on that data, so you cannot afford to get it wrong.
With an emphasis on the importance of edge technologies and their appropriate application, they must be considered value added, correct? No, they are not, but the eventual utility and transformational potential of data is impossible without them. Shigeo Shingo once observed that the last turn of a bolt is the one that tightens it (possesses value), all the other turns are just movement, or a path to tangible value. In the case of data harnessing or mastery, capture, control, and understanding are the turns of the bolt leading to that final tightening turn, which in our case is the conversion of data into appropriate corresponding action.
Reacting in Real Time
Now that we have collected, standardized, and organized all the shop-floor data, we can use the resulting information to react and impact manufacturing performance. Of course, data collection initiatives or IIoT/MES equipped with the capability to capture and coordinate data can be complex and possess many bells and whistles. However, in their most elementary and important forms, they must provide two things: Immediate performance data reporting aimed at the treatment of acute pain, and a historical perspective to establish baselines of performance to drive learning and a more protracted and sustainable approach to pain management. There is nothing in the various technology suites of IIoT/MES solutions that is as powerful and potentially transformative as the provision of “now” and “before” performance data. And of these two data types, mastering the now data has been the saving grace of many a struggling manufacturing company. It could be argued that the mastery or harnessing of now data is — or should be — the primary objective of any manager responsible for a dysfunctional or struggling operation, in the short term at least. After all, if the now is unmanaged and unstable, how could later be any different?
Of course, operational data in isolation, without context, are just numbers with no intrinsic value. Real-time targets and planned states of operation provide the picture of the ideal state that the now data begs to be viewed against. And it is this contextualization that establishes an understanding of the data.
One example: I can see the last 10 cycle times of my forging press. If that is all I am seeing, I might as well not be looking. Those are just numbers with no contextual value and provide no understanding. An example of superficial understanding would be if I can see the actual cycle times and the corresponding target cycle times. An improvement over superficial understanding would be actuals and targets with color-coded delta (green – good, red – bad). Even better would be color-coded deltas with corresponding descriptions (e.g., red, reduced production, parts sticking). I can now take appropriate action to address the cause of actual vs. target deltas because I understand the situation and the best course of action.
“Data without capture, control, understanding, and action serves no purpose and adds no value.”
My decision velocity has increased thanks to now data feedback (do I intervene in the current forging press performance? It is red, so the answer is yes). My action velocity has increased thanks to now data feedback (I am involving die maintenance in my intervention because I know the parts are sticking). As a result of increased decision and action velocity, the operation experiences increase in throughput velocity. As I am reacting to real-time shopfloor feedback, I am effectively triaging the operation to remove pain and elevate health by way of increased performance capability. What is increasing performance capability? Again, increases in decision and action velocity driven by understanding.
So, it’s a necessity to have the capability to react in near real time. However, when the frequency of needed action or intervention remains high for too long and becomes operational best practice for management, it becomes unsustainable and gradually becomes known by an all too familiar term — firefighting. Analysis over time can provide the clarity necessary to reduce the frequency of necessary reaction, thus providing higher levels of performance stability, capability, and predictability.
Analyzing Over Time and All the Time
We have established that the provision of immediate or now data is a very important component of an effective data-collection initiative or IIoT/MES solution. We also understand that a reliance on now data coupled with action, while critically necessary in doses, can and eventually will become an overwhelming strain on everyone. To begin to introduce sustainable operational stability while in a triage phase, you will need to leverage the second critical component of an effective solution: a historical perspective in the form of historical performance and status data.
Using the earlier forging press example, intervention in a reduced production scenario due to sticking parts will almost certainly result in the repeated intervention in sticking-parts issues, unless you can build a historical narrative around the subject illustrating things such as frequency of sticking, types of material while sticking, die identification while sticking, temperatures while sticking, speed of cycle while sticking, etc. Once you build the narrative, you can take action in the form of root cause analysis and countermeasure development to address the contents of the narrative. The issues are gradually put to bed, the frequency of occurrence gradually drops, and the shift from triage to stability begins. This is the power and potentially transformative quality of historical data. It is something that is provided by an effective data-collection initiative or a high-quality IIoT/MES solution.
“With the right help and the
right tools, harnessing or mastering your data can be as easy as a coachman harnessing a horse.”
The provision and importance of historical data must counterbalance the provision and urgency of current or now data, otherwise the pursuit of operational capability and stability is destined to end in frustration, burned-out employees, and failure. The sticking-parts example used to illustrate the importance of historical perspective is a simple one, but it illustrates the fact that an effective approach to understanding and conversion to action is one that can traverse multiple levels of complexity and operational problems. DMAIC (Define, Measure, Analyze, Improve, Control) is a fine methodology for the identification and resolution of problems. Of course, the “D” in DMAIC requires a distinct problem definition, and without historical perspective, establishing that definition is problematic at best, impossible at worst. Name any popular improvement methodology and you will find that it relies on some form of gap analysis between current state and intended state. Without historical perspective, the current state cannot be understood, much less articulated.
Now, there is no shortage of opportunities to collect and learn from data (current or historical), so how do we avoid the pitfall of analysis paralysis? By determining what is commonly referred to as the critical few, or Pareto’s Law, or the 80/20 rule — basically, prioritization by segregation and ranking. Utilizing easy-to-understand KPIs certainly helps. A KPI like OEE is an effective performance influencer because it breaks down a higher level metric into one that is approachable on three fronts: availability, performance, or quality. The simplicity of this measurement aids in narrowing focus, thus speeding up resolution. If my OEE is historically hovering at 65-70%, which component of OEE is really driving this level of performance? I have three to choose from — choices that serve as the beginning of paretoization or prioritization by segregation and ranking. Another effective way to avoid the peril of analysis paralysis is to view performance through a statistical lens. A simple line chart generated in Excel might lead one to believe that a few high or low data points might warrant action (Figure 2).
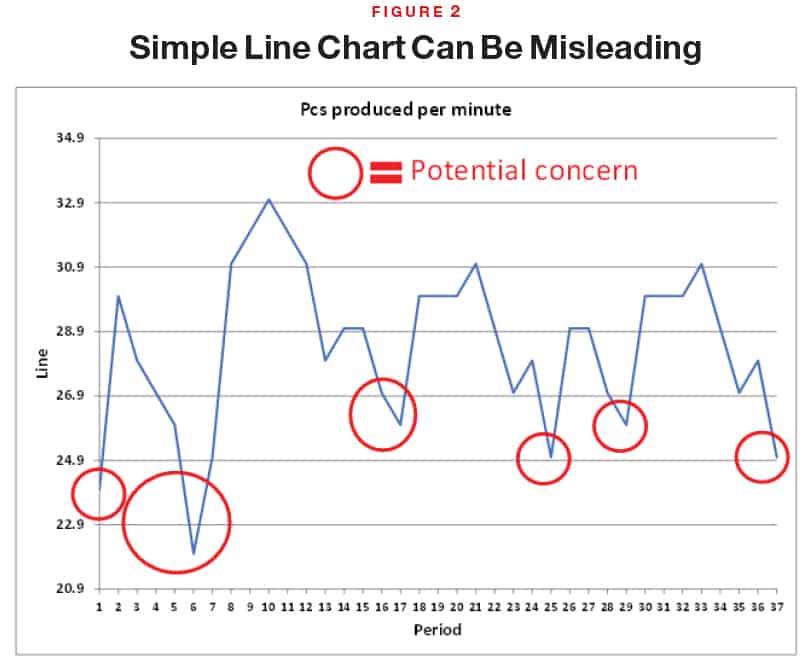
However, a control chart utilizing zones of deviation might, and probably will, show those same data points as normal variation within the process, suggesting that your efforts and attention would be better placed elsewhere (Figure 3).
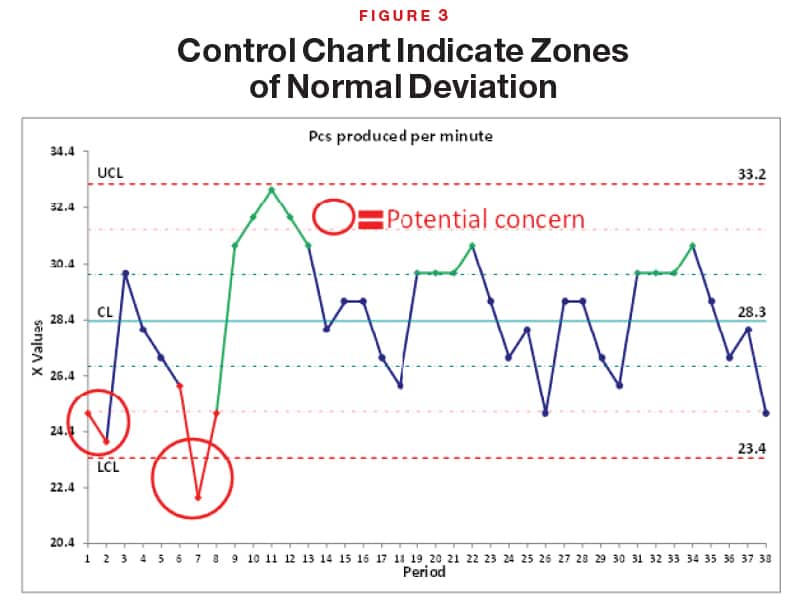
Statistical analysis can help differentiate normal variation from special cause variation, enabling the end user to prioritize action and avoid unnecessary intervention. Sometimes, the best action is no action.
Actionable, real-time data really is the lifeblood of any operation in need of cost reduction, performance improvement, an increase in customer satisfaction, or one that strives to become a manufacturing employer of choice in the community. Data without capture, control, understanding, and action serves no purpose and adds no value. With the right help and the right tools, harnessing or mastering your data can be as easy as a coachman harnessing a horse. M
References
“The New ROI: Return on Information,” Manufacturing Leadership Journal, April 2020. www.manufacturingleadershipcouncil.com/the-new-roi-return-on-information-11762/
“Building the Business Case for M4.0,” Manufacturing Leadership Journal, February 2021. https://www.manufacturingleadershipcouncil.com/building-the-business-case-for-m4-0-18772/